
Go back to RESOURCES
Basic Principles Of Fluorescence And Ion Sensing
Introduction
This is a very, very basic introduction into the theory of fluorescence measurements and its practical implications as applied to experiments done using IonOptix equipment. For a thorough understanding you are better off reading some of the references provided below. If you have only five minutes and are completely new to the topic or need a reminder of some of the basics, this might be a good starter. Comments are of course always welcome.
The basis for fluorescence, the Stokes shift
Fluorescence is based on the property of some molecules that when they are hit by a photon, they can absorb the energy of that photon to get into an excited state. Upon relaxation from that excited state, the same molecule releases a photon: fluorescence emission. The energy of the photon that is released is always lower than that of the photon that was absorbed. So the photon that excites the dye always has a smaller wavelength than the photon that gets emitted. This is the so called Stokes shift. Fluorescein-based dyes for example, get excited at a wavelength around 500 nm, blue light, but emit at around 530 nm, which is green light. Dyes don’t get excited by just one exact wavelength, but by a range of wavelengths around a peak, the excitation spectrum. When people talk about the excitation wavelength of a dye, they usually mean the peak of the excitation spectrum. The same is true for emission, there is an emission spectrum, characterized by a peak in the spectrum. Companies that sell fluorescent dyes usually provide the excitation and emission spectra. Excitation spectra are often graphed as relative efficiency in photon absorption (which leads to excitation). You need to know the emission and excitation spectra of a dye to be able to pick a proper filter set to measure that dye.
The fluorescent properties of a dye are determined by its chemical structure. When a dye is dissolved, the solvent, in our experiments usually a salt solution, will affect the dye’s chemical surroundings. This can affect the dye’s chemical structure which in turn changes its fluorescent properties. This is the basis for using dyes as sensors. It is also the source of trouble sometimes, for example when a change in pH effects the fluorescence in a dye that is supposed to measure only calcium.
Most people that use the IonOptix fluorescence equipment do so to get a measure of an ion concentration inside a cell, whether this is calcium, magnesium, pH or something else. How does a dye sense an ion concentration? The dye will bind the ion that you want to measure and the binding of the ion induces a structural change that changes the dye’s fluorescent properties. For example in Fluo-3, a calcium sensing dye, the binding of calcium increases the efficiency with which photons are absorbed (the quantum efficiency of the dye http://en.wikipedia.org/wiki/Quantum_efficiency). This results in increased brightness: with the same amount of excitation light, a Fluo-3 molecule produces up to 200x more emission light after calcium has bound to it. For most dyes ion binding is a reversible process, upon releasing the ion its old fluorescent properties will return.
Ion sensitivity of a dye: Kd
There will always be a mix of dye molecules bound to its target ion and dye molecules not bound to the target ion. This will be a dynamic equilibrium, and all the chemistry you have learned for dynamic equilibriums will apply. The fraction of dye bound to its target ion depends on its affinity for the ion and the concentration of the ion itself. With fluorescence dyes, the affinity for a specific ion species is normally defined by the dissociation constant of the dye, Kd (http://en.wikipedia.org/wiki/Dissociation_constant for a reminder). Why is it important to be aware of the Kd? It will tell you for which ion concentrations your dye is suitable, and at which concentrations you get in trouble.
How to pick a dye based on Kd
The rule of thumb is that the ion concentrations that an ion specific dye can reliably measure are between 0.1 x Kd and 10 x Kd. This is based on the equation for a dynamic equilibrium; within this range a change in ion concentration will result in a measurable shift of the fraction of ion bound dye. When the ion concentration is too low for the dye, you’ll have a very poor signal to noise ratio, as there will be almost no change in fluorescence with a change in ion concentration. The same is true if the concentration is too high; almost all the dye will be bound to its preferred ion species, and there will be no measurable change if the concentration rises further. Worse, the dye can start to act as a buffer, by binding a significant portion of the available ions.
Take skeletal muscle fibers as an example. The resting calcium level is approximately 100 nM. So Fura-2 with a Kd of 0.1-0.2 μM would be ideally suited to measure changes in base level. However, people are mostly interested in the peak height and the kinetics of the transient. The peak height can be up to 3-4 μM, and the peak of the transient lasts only a few miliseconds. A much more appropriate dye would then be Fura-2 FF, wich has a Kd of 5.5 µM. Fura-FF does not help you in subtle changes in baseline, but is excellent for studying the rapid kinetics around the peak and is essential in getting a good estimate of the peak.
The effect of ion binding: brightness and spectral shift, ratiometric dyes
Ion binding changes the fluorescent properties of the dye. It can do this in two ways: by increasing the quantum efficiency of the dye, making it brighter; or by changing the spectral characteristics of the dye, shifting the wavelengths at which the dye gets excited or at what wavelengths it emits. When only the brightness changes, it is a so called ‘single excitation – single emission dye’. Fluo-3 is an example. When the wavelength at which the dye is excited changes, it is usually referred to as a dual excitation dye. When the wavelength at which the emission changes, it is called a dual emission dye. Examples of dual excitation and dual emission dyes are respectively Fura-2 and Indo-1, both used to measure calcium.
Single excitation, single emission, pros and cons
Probably the majority of dyes are single excitation single emission dyes, where only the brightness changes. The clear advantage of these dyes is that only one wavelength is needed for the excitation, and only one wavelength needs to be measured at the emission side. This greatly simplifies the equipment needed to do measurements. The single biggest drawback is that it can be much more difficult to extract quantitative data about ion concentrations. The only measure is a change in brightness. Brightness does not only vary with the ion concentration, but is also dependent on the amount of dye being measured. The amount of dye that is loaded is very difficult to control for. Where dye loading can be partially accounted for by normalizing the data, the fluorescence also varies over time, as exposure to dye will lead to bleaching, effectively reducing the concentration of dye, and sometimes expulsion of the dye by the cell. Single excitation-single emission dyes are usually excellent for tracking the kinetics of changes in ion concentrations, but it is much more complicated to collect absolute data about ion concentration that can be compared from experiment to experiment. For this ratiometric dyes are more suitable.

Ratiometric dyes, isosbestic point
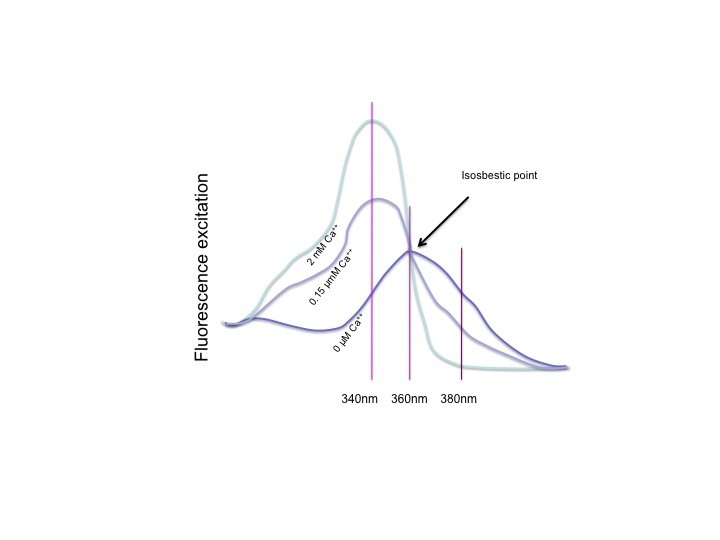
All ratiometric dyes show a spectral shift upon binding their preferred ion. This can be the excitation spectrum or the emission spectrum. Which one it is doesn’t change the principles of ratiometric measurements, just the equipment you need to measure it. The figure above shows the excitation spectrum of Fura-2, at 0 Ca++, an intermediate calcium level and for a saturating Ca++ solution. When the dye is saturated with calcium, the peak is clear, at 340nm, UV light. With 0 Ca++, the peak is at about 360 nm. This is however not where it is measured. The absorption (photon absorption, which results in excitation) at 360nm is the same for all calcium concentrations. This is the so called isosbestic point, where the fluorescence is independent of the calcium concentration. Although 360 can be used, usually Fura is measured at 380nm, where absorption is lower, but the dynamics upon calcium change are highest. To calculate the ratio, 340nm is used for the numerator and 380nm for the denominator, so that the ratio goes up when calcium goes up, and the ratio goes down when calcium goes down.