
Go back to RESOURCES
Transient Analysis Features
Transient Analysis
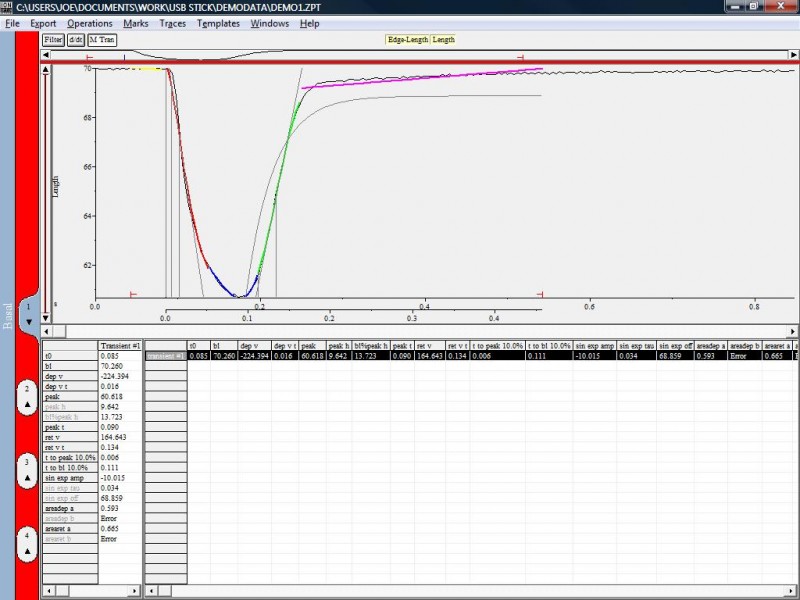
IonWizard has extensive transient fitting capacities. Each transient is marked for analysis either automatically or manually via IonWizard’s transient mark facility. Transients are fit by a series of high order polynomials to arrive at a mathematical model of the curve. This model is used to determine a variety of characteristic transient parameters (over 30 in total). IonWizard automatically detects upward or downward going transients and calculates and presents the parameters appropriately. The user may peruse each transient to confirm the accuracy of the fits. A graphical feedback mechanism permits verification of each parameter. The transient parameters can be exported to a file or copied directly into a spreadsheet using the clipboard.
Transient Parameters Resolved by IonWizard
·Time Zero. The beginning time of the transient. This can be found three ways: via a baseline finding algorithm, by user specification, or keyed off an external mark.
·Departure/Return Velocity (i.e. dC/dt, dL/dt). The maximum (minimum) velocity reached on but the rising and falling phases of the transient. These values can also be presented as a percentage of the baseline value and as a percentage of the transient height. The time of the departure/return velocity is also given.
·Peak/Peak Height. The peak is the highest/lowest value reached by the transient. This parameter is also used to calculate peak height. The height can be shown as a percentage of the baseline (i.e. percent shortening for length data). The time of the peak relative to time zero is also given.
·Time to % Peak / Time to % Baseline. The user can configure IonWizard to find the time required for the transient to reach up to three different levels on the rising an falling phases. These times may be reported relative to either time zero or to the peak time.
·Exponential Fit. A single exponential curve is fit to the trace starting at one of three places: the peak, the time of maximum return velocity, or some user defined % return to baseline. Three parameters are fit, amp, tau, and off. The equation fit is y=amp*e-t/tau+off.
·Bi-exponential Fit. A bi-exponential curve is fit to the trace starting at time zero. Four parameters are fit: amp, tau rise, tau fall, and off. the equation fit is y=amp* (e-t/tau fall – e-t/tau rise) +off.
·Area. The area under the curve (i.e. from baseline to peak) is calculated for two time ranges: from time zero to peak and from the peak to the end of the transient. For upward going transients, the area from the baseline down to zero is also found for both time ranges.
The following pdf download provides a full description of the mathematical fit of the data followed by a description of each of the analysis results and their application.